By Kieva McLaughlin
Some 163 people have been killed on Irish roads so far in 2016, compared to 131 people at this time last year. Specific figures will not be released until early next year, but trends that were looking optimistic after last year aren’t holding up.

Looking at the figures and statistics on road deaths last year and over the last 10 years can help discover what kind of trends are occurring and who is most at risk.
Road deaths were the second lowest in Ireland in over half a century in 2015. Mayo had the highest number of fatalities per 100,000 people (10), while Dublin had very few, with just 1.3 per 100,000.
Dublin (17) and Cork (16) had the highest number of road fatalities in Ireland (because of their high populations) while Roscommon and Waterford both had no road deaths. Cathal Lynch from the RSA said that even though the two counties had no road fatalities last year, “It’s impossible to infer a trend from just one year of data,” so this does not necessarily mean they will continue on this course.
Some 29% of people who died in 2015 were not wearing seat belts, which could have been the deciding factor in their death. Almost one in three collisions were alcohol related with even a small amount of alcohol increasing the risk of being involved in a fatal crash. A shocking one in ten drivers (284,000) admitted to drinking before driving in the 12 months prior to November 2015, with 2 out of 5 of these drinking two or more drinks.
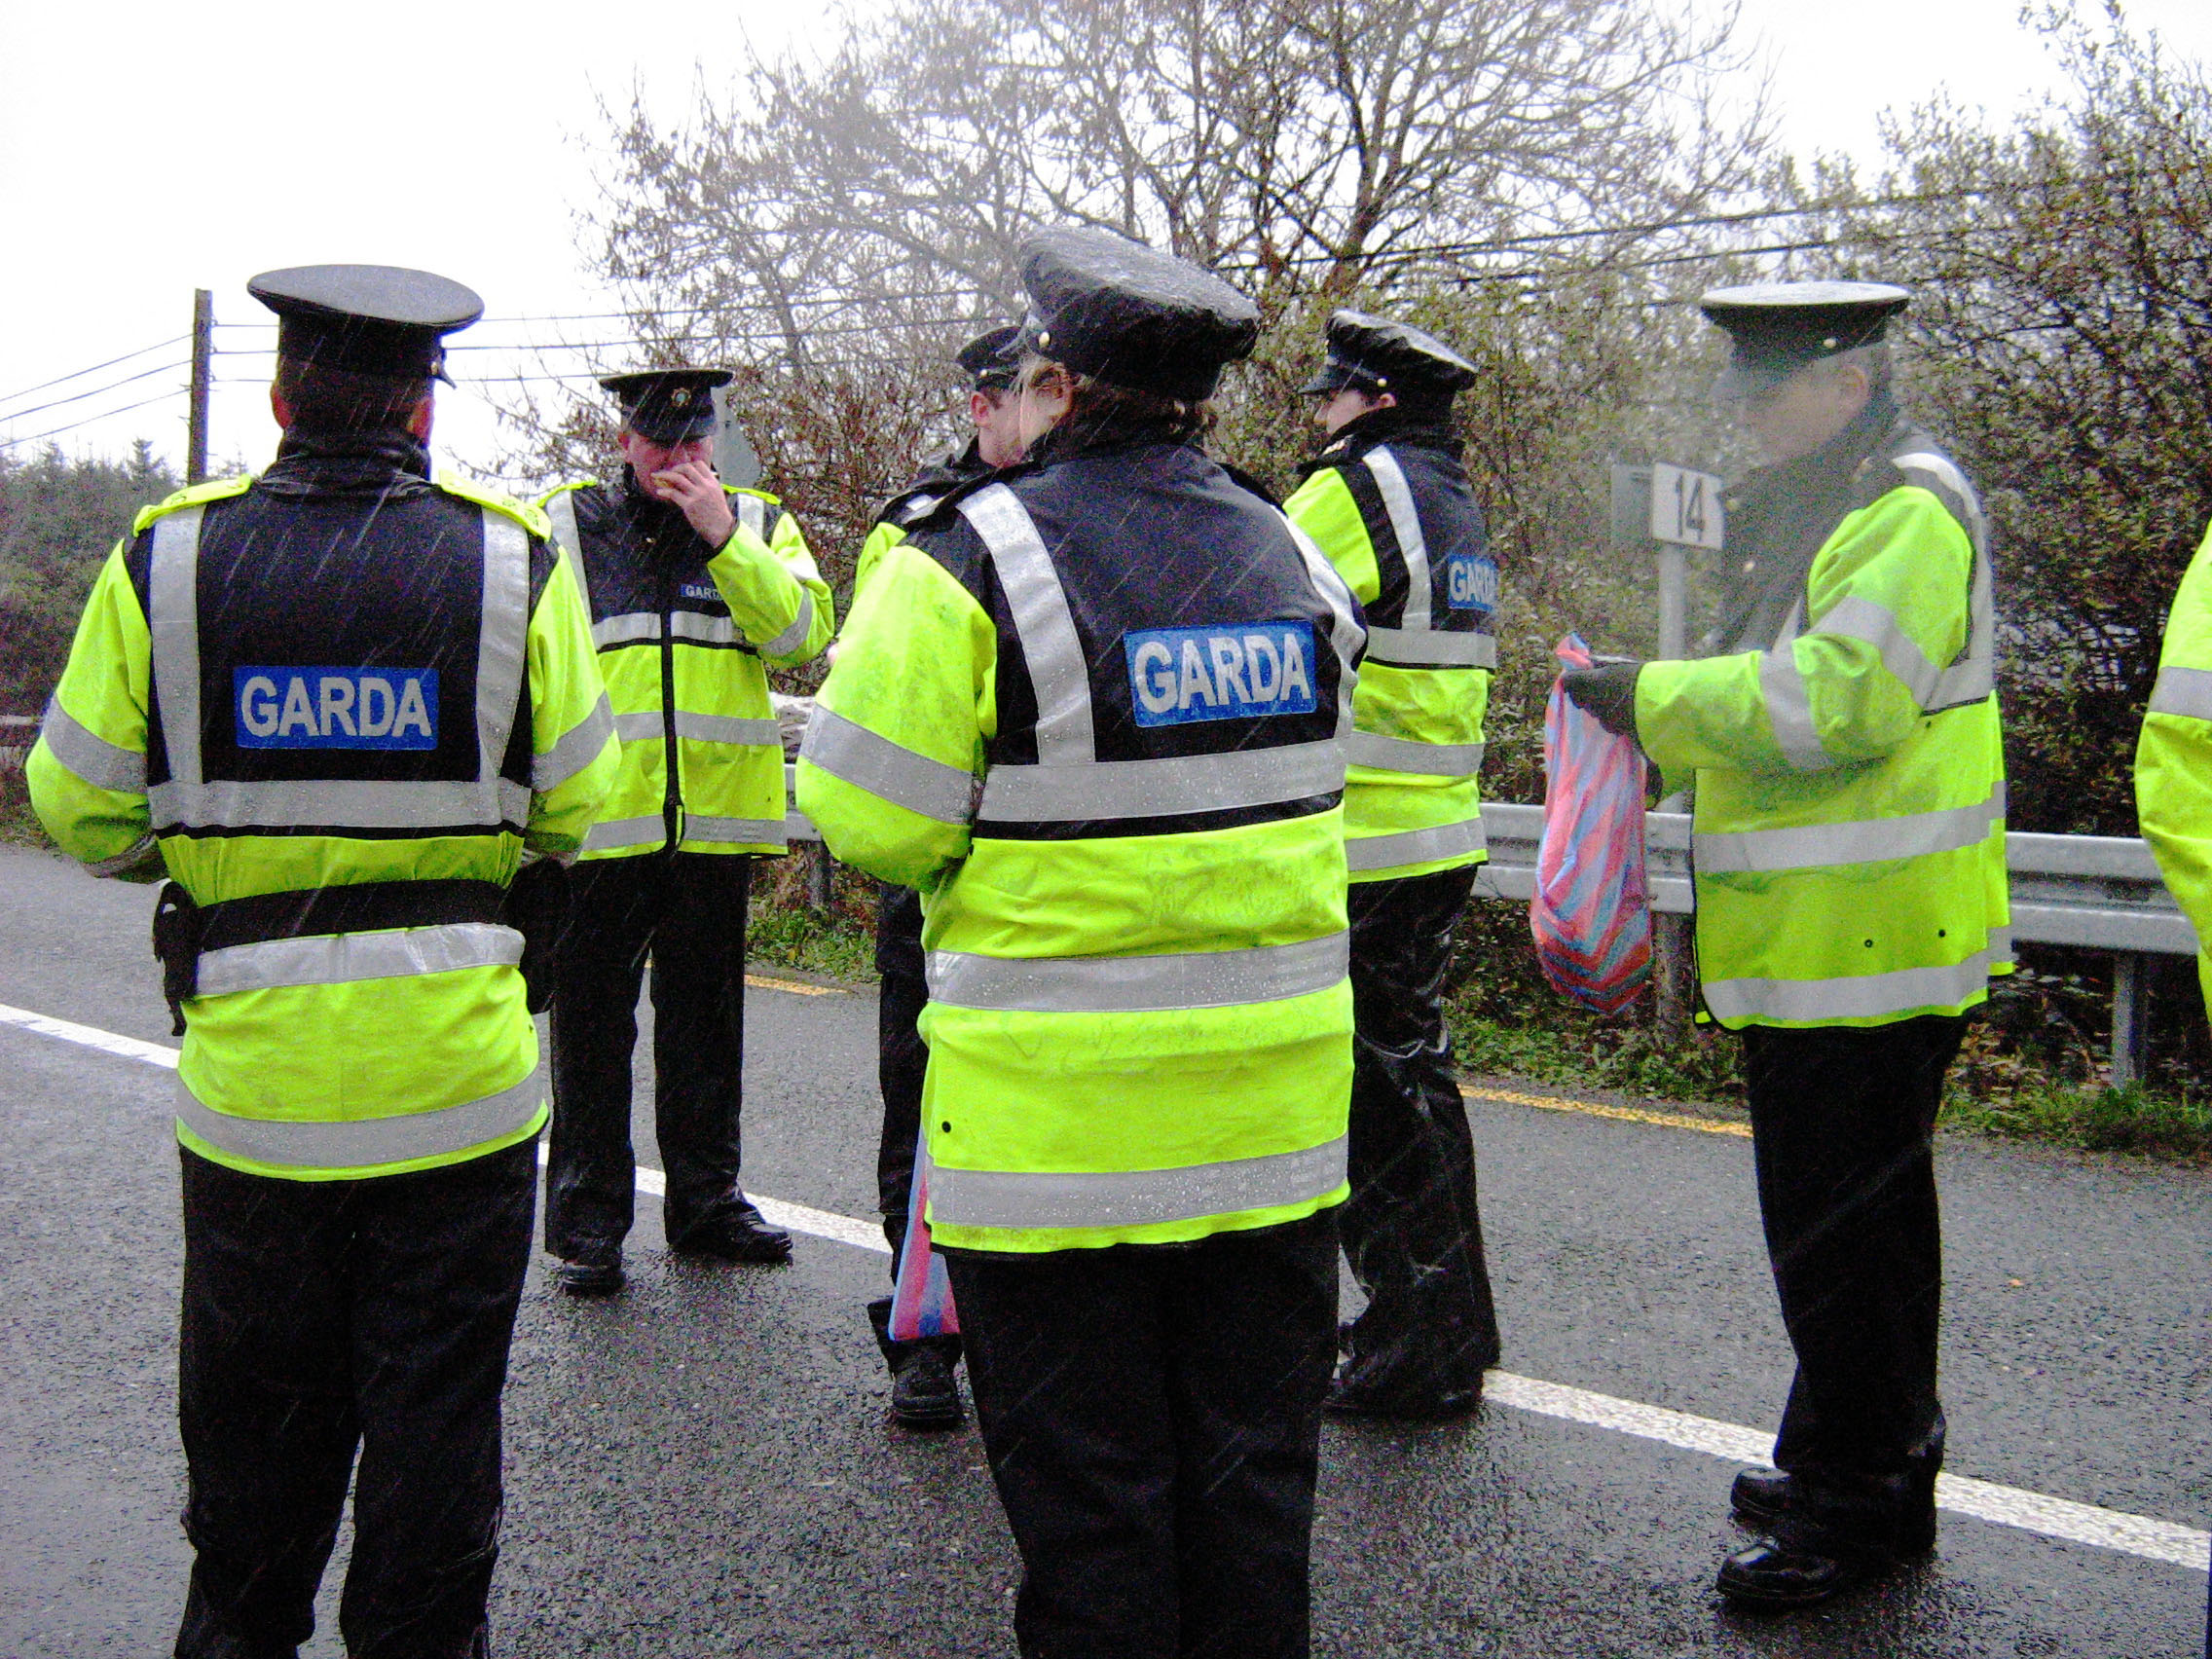
Garda Grace Byrne of Blackrock Garda station said, “People might see the stereotypical drink driver as a man having a few pints after work and then driving home. But I have noticed in recent times that there is an increase in young females being arrested for drink driving.” She has also noticed that there are more people being arrested the morning after, “they’ve been out drinking the night before and are still over the limit the next day, without even realising.”
Donegal has had the highest number of fatalities for its population continuously in the past decade, with 18.3 per 100,000 in 2005, but is making improvements, going down to almost a third of that in 2015 with 6.8 deaths per 100,000. In the last five years Roscommon has gone from 14 in 2010 (per 100,000 people) to 0 in 2015. Dublin and Cork are steadily getting lower and Galway had a huge drop from 2005 (9.1) to 2010 (2.4) but rose again in 2015 (4.8).

In 2015, the most vulnerable age group was 16- 25 year olds with 27% of all road fatalities. The elderly had the second highest number of road deaths with 19% and the 26-35 year age group closely followed with 17% of all the road fatalities.

The highest number of road deaths are drivers, totaling 46% of road fatalities in 2015. Vulnerable road users (pedestrian, motorcyclist and pedal cyclist) accounted for 38% of road deaths with the highest number being pedestrians. This was only down 2% in 5 years from 21% in 2010 to 19% in 2015.

A total of 76 drivers were killed in 2015, this is the same number as 2014 and down from 91 drivers in 2010.
Younger drivers were most susceptible, accounting for 25% of all drivers killed (16-25 years). The majority of driver fatalities occurred on country roads, and in particular on roads with a higher speed limit (shown below). Garda Grace Byrne thinks the main reason for accidents in Ireland is speed, “Speed is a killer, the faster you are driving and collide with a vehicle the less likely your chances are [of surviving].” As shown below, males accounted for 76% of driver fatalities.

| Speed Limit | No. of Deaths |
| 30 km/h | 1 |
| 50 km/h | 6 |
| 60 km/h | 6 |
| 80 km/h | 31 |
| 100 km/h | 29 |
| 120 km/h | 3 |
|
Total |
76 |
Table 1 (Created by Kieva McLaughlin, Figures Source: RSA)
In 2014, almost 25,700 people died in European Union countries. Over 200,000 people suffered serious, life changing injuries. However, in 2000 very few EU member states had a fatality rate lower than 8 deaths per 100,000 inhabitants but in 2014 there were only 5 EU countries with a fatality rate higher than that. There were a total of 5,700 less deaths from 2010 – 2014.
Malta, the Netherlands, the United Kingdom, and Sweden had the lowest number of fatalities, all below 3 deaths per 100,000. Lithuania, Bulgaria, Romania and Latvia had the highest number of road deaths all having 9 or more per 100,000. Latvia had the highest with 10.5 road fatalities per 100,000 people living there.
The road fatality rate of nearly every country lowered from 2010 to 2014 except Latvia which rose from 10.3 to 10.5 (per 100,000). Sweden and Lithuania both increased by 0.1 each and Estonia stayed constant at 5.9 deaths (per 100,000).
The EU average in 2010 was 6.3 and lowered to 5.1 in 2014. Ireland was below the EU average both years going from 4.7 to 4.3. An EU road safety plan wants to reduce the road deaths by half from 2010 to 2020. Although the rate has lowered by around 19% since 2010 it has only lowered 1% from 2013 to 2014. This means the rate is slowing down rather than speeding up, which, if continued at this rate, will not reach the EU’s goal.
Pedestrian fatalities are not decreasing as much as the overall rate, with 22% of all killed on the roads in 2013 being pedestrians. Pedestrians are at a higher risk in urban areas and the elderly are particularly vulnerable. Ireland was below the EU average at 18%. The Netherlands, Finland, Belgium and France were all below 15% and in Poland, Latvia, Lithuania and Romania over a third of people killed were pedestrians.
The EU has the lowest fatality rate of any region in the world, with the USA having double its rate at 10.2 (per 100,000) in 2014.

Footnote:
Country Abbreviations: AT Austria, BE Belgium, BG Bulgaria, CY Cyprus, CZ Czech Republic, DE Germany, DK Denmark, EE Estonia, EL Greece, ES Spain, FI Finland, FR France, HR Croatia, HU Hungary, IE Ireland, IT Italy, LT Lithuania, LU Luxembourg, LV Latvia, MT Malta, NL Netherlands, PL Poland, PT Portugal, RO Romania, SI Slovenia, SK Slovakia, SE Sweden, UK United Kingdom.
You must be logged in to post a comment.